| Monitoring methods and evaluation of displayed parameters - EN |
| 1. RESERVOIRS AND WATER QUALITY |
| From the perspective of water quality importance, reservoirs can be divided into: |
A) Drinking Water Reservoirs
B) Fish Ponds C) Other Reservoirs |
| DRINKING WATER RESERVOIRS | |
|
They serve as a source of drinking water for a large number of inhabitants. They are precisely defined by Decree of the Ministry of Agriculture No. 137/1999 Coll. The administration of these reservoirs is entrusted to the individual River Basin Management companies. In the Elbe River Basin, 5 drinking water reservoirs are defined in this way. In accordance with § 30 of the Water Act No. 254/2001 Coll., protection zones are declared around these reservoirs. The 1st degree protection zone is declared in the immediate vicinity of the water reservoir. Its regime usually includes a ban on entry. The 2nd degree protection zone is established according to local conditions and has a more relaxed regime. The protection zones are marked in the field with warning signs. Water quality is subject to strict criteria. The quality in the tributaries is assessed according to Government Regulation No. 61/2003 Coll. At the point of abstraction to the treatment plant, the quality is evaluated according to Decree of the Ministry of Agriculture of the Czech Republic No. 428/2001 Coll. |
 |
| FISH PONDS | |
 |
These are reservoirs that primarily serve for fish farming within the meaning of Art. 4, letter a, § 8, Act No. 254/2001 Coll. Various entities manage these types of reservoirs. All activities on the ponds, including water quality, are primarily subordinated to the economic result, which is the maximum yield of fish meat. On many ponds, an exception is granted for the application of fertilizers and active substances according to letters b and d of § 39 of Act No. 254/2001 Coll. This measure ensures the intensification of fish production in the given reservoir. The intensification of the pond should take place in the spirit of the rules set by the Methodical Instruction of the Ministry of the Environment and the Ministry of Agriculture of the Czech Republic No. 35508/2002-6000. |
| OTHER RESERVOIRS | |
|
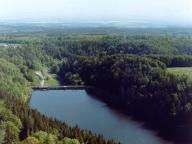
They are intended primarily for purposes that are not dependent on water quality (energy, flow augmentation, flood protection, etc.). Functions directly dependent on water quality, such as swimming, water sports, and fishing, are secondary. Nevertheless, at many of these water reservoirs, bathing places are designated according to § 34 of the Water Act, so-called "surface waters used for bathing". In these locations, the water quality must comply with the limits set by the Decree of the Ministry of Health of the Czech Republic No. 464/2000 Coll. A total of twelve such places suitable for bathing are designated at the Elbe River Basin reservoirs (Decree of the Ministry of Health of the Czech Republic No. 159/2003 Coll.). However, the water quality must also allow for suitable conditions for the life of fish and other aquatic animals. The state enterprise Povodí Labe manages eleven reservoirs that can be classified as "other". |
 |
| 2. MONITORING OVERVIEW |
| WHO AND WHERE? |
|
Systematic monitoring is carried out mainly at drinking water reservoirs. Here, the reservoir administrators (River Basin Management companies) and water supply companies cooperate. In fish ponds, the operators of fish production carry out their own operational measurements as needed.
On intensified fish ponds where an "exception" is granted (see the Fish Ponds chapter), water quality monitoring is also carried out as stipulated by the water management decision. On other reservoirs, the level of monitoring is adapted to local needs and requirements. It is primarily ensured by the reservoir administrators. On reservoirs with designated "surface waters used for bathing," intensive monitoring during the bathing season is ensured by the public health authorities. |
| WHAT? |
| To assess the water quality in reservoirs, it is necessary to know the substance input into the reservoir and the results of the processes within the reservoir. Measurements on the tributaries primarily evaluate the substance transport, and thus the importance of the catchment area in shaping the water quality in the reservoir can be classified. The data obtained in this way usually signal the movement of substances over a certain time unit and can therefore be described as dynamic data (see diagram below). |
 |
| The distribution of substances in the reservoir space and the development of individual processes in the reservoir during the year can be analyzed using so-called static data (see diagram above). It is characteristic of this data that it usually relates to a unit of volume and is directly tied to the reservoir space. |
| METHOD? | |
|
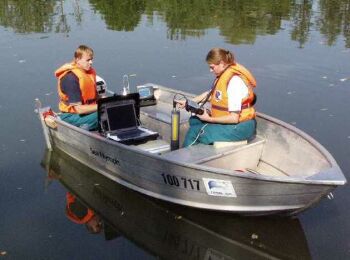
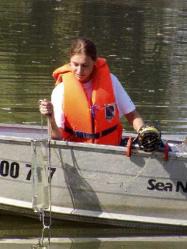
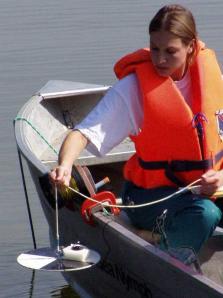
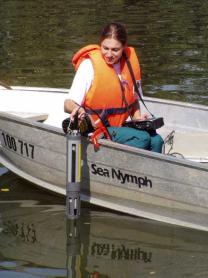
Dynamic parameters - Hydrological data (inflow) are measured either automatically on a limnigraph or from the difference in reservoir levels. Chemical, physical, microbiological, and hydrobiological determinations are carried out in a laboratory from point samples manually collected at designated profiles on significant tributaries to the reservoir. Static parameters - Hydrological data are regularly measured by the waterworks staff. Some qualitative analyses are performed with modern instruments directly in the field (in-situ determination). The output is a digital signal that allows for almost immediate evaluation of the current conditions on the surface and at depth. These measurements are carried out on permanent verticals, where information is collected with a depth measurement step of 1 m. However, most measured parameters require laboratory determination. Therefore, additional water samples are collected from these verticals with a depth sampler for laboratory analyses (image on the right). |
 |
| WHEN? |
|
Dynamic parameters - Hydrological data is provided daily by the waterworks staff. Sample collection on tributaries is carried out 6 - 12 times a year, depending on the importance of the reservoir. Static parameters - Hydrological data is provided daily by the waterworks staff. Transparency is measured twice a week after the ice thaws. Limnological measurements on reservoirs are very demanding and are therefore carried out only 4 - 6 times a year. If necessary, extraordinary monitoring is conducted. |
| 3. PROCESS INDICATORS |
|
They are determined at fifteen reservoirs of the Elbe River Basin - i.e., at waterworks with permanent staff. Process parameters indicate the development of water quality in the reservoir just below the surface, usually in the area of the dam wall (with the exception of the exchange coefficient). The current record of these indicators can be viewed by clicking on the blue square marked on the plans of all fifteen monitored reservoirs. |
| WATER TEMPERATURE AT THE DAM | |
 |
It is measured daily a few centimeters below the surface at seven in the morning. During freezing, temperature measurement is limited to once a week (on Wednesday). The temperature is measured manually with a calibrated thermometer. Changes in this parameter primarily allow for assessing the development of conditions during the year and creating comparative analyses with the previous period. It is a suitable indicator of the onset and departure of ice phenomena and, in reservoirs suitable for recreation, it signals conditions for swimming. |
| WATER TRANSPARENCY AT THE DAM | |
|
If the surface is not frozen, transparency is measured at the reservoir twice a week from March 1st to October 31st. The measurement is carried out according to local conditions, either from a boat or from a suitable platform near the water surface. Transparency is measured using a standardized Secchi disk. It is a disk with a diameter of 30 cm with four distinct quadrants and a calibrated ten-meter line – see image on the right. The Secchi disk, suspended on the calibrated line, is submerged below the surface until it is no longer visible. The moment the disk can no longer be distinguished, a depth reading is taken in cm. The measurement is repeated three times, and the average value is the result of the measurement. Transparency is measured in the shade to eliminate the effect of surface glare. The measurement is carried out at the same time of day. By determining transparency, it is possible to quite simply capture serious changes in water quality, which are caused either by the development of various groups of organisms or by inorganic turbidity caused by floods or bottom sediment resuspension. Changes in transparency are an important indicator of possible complications at the water treatment plant for drinking water reservoirs and significantly affect the level of recreation at other reservoirs. According to the consequences for the biological regime, production processes, and the existence of some aquatic communities, turbidity can be distinguished as caused by: a) Inorganic, clay particles (reducing the orientation ability of fish and clogging their gills and the filtration apparatus of aquatic organisms). b) Mass occurrence of bacterioplankton, phytoplankton, and organic remains of decomposed vegetation (detritus). Collectively, these are called vegetation turbidity. This turbidity is the basis of the food chain for other aquatic organisms. |
 |
| Range and limits: Transparency ranges from a few decimeters in eutrophic summer reservoirs to six-to-seven-meter values in mountain reservoirs during the autumn circulation. |
| According to the Decree of the Ministry of Health No. 464/2000 Coll., for waters suitable for bathing | |
| in the open | a value of 200 cm is recommended. |
| The limit value for transparency is | set at 100 cm! |
| WATER EXCHANGE COEFFICIENT | |
| The stability of quality conditions in a reservoir is determined not only by the amount of pollutants in the catchment but also by the intensity of transport of these pollutants into the reservoir. This process can best be evaluated in the relationship between the inflow size and the volume expressed in time. Thus, the exchange coefficient is defined, which expresses in percentage the size of the current reservoir volume replaced by the inflow over twenty days. This means that an exchange coefficient of 100% represents a state where the original accumulation of the reservoir was completely replaced by inflowing water during the previous 20 days. The time length of twenty days was determined empirically from the length of the reproductive cycles of planktonic organisms. |  |
 |
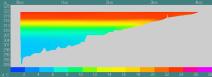
By comparing the curves showing the development of transparency and the exchange coefficient, the cause of a significant decrease in transparency can also be deduced. With a high exchange coefficient, strong mineral turbidity can be identified, and with a low exchange coefficient, excessive development of algae and cyanobacteria can be manifested. |
|
Types of reservoirs according to the characteristic exchange coefficient:
|
| CHLOROPHYLL-A AT THE DAM | |||||||||||||||||||||
|
Water samples for determining the concentration of chlorophyll-a are collected after the ice thaws in the period from March 1st to October 31st, once a month, by employees of the water management laboratories. The sample is collected with a special sampler (Pospíšil type) from the dam crest above the deepest point. The sample transport and chlorophyll determination by extraction into ethanol are carried out according to the valid ČSN standard, which is an approved methodology of the Elbe River Basin water management laboratory. Chlorophyll-a is an important functional component of the body of all higher plants, algae, and cyanobacteria. From the value of the concentration of this substance determined in the water, the level of occurrence of algae and cyanobacteria at the measurement site can be assessed with high accuracy. |
|||||||||||||||||||||
Range and limits: In the conditions of the Elbe River Basin, chlorophyll concentrations range from values less than 1 µg/l (mountain reservoirs - Josefův Důl reservoir in the Jizera Mountains) to values higher than 500 µg/l (peak vegetation - Vrchlice reservoir near Kutná Hora). According to the classification of the Water Research Institute, the state of eutrophication or trophy of the reservoir (the level of risk of excessive algae development) can be evaluated based on the following division into five categories.
|
 |
||||||||||||||||||||
| 4. INDICATION OF SUBSTANCE DISTRIBUTION |
 |
It is derived from determinations carried out on verticals, which are permanently surveyed on the reservoirs (see chapter Monitoring Overview). A total of ten reservoirs are monitored in this way. The location of the verticals is marked on the reservoir plans with a yellow circle. By clicking on this symbol, the distribution of the selected parameter's values in the given cross-profile can be displayed. By clicking anywhere on the surface in the plan, the spatial distribution of the selected parameter in the longitudinal section (profile) of the reservoir is displayed. This is led above the original channel of the impounded stream. At the same time, the development of the selected parameter is displayed on the so-called horizontal plan, which shows the situation on the surface. Spatial visualization is made possible by processing the measured values in the unique software Re-Viewer, which was developed in cooperation with DHI Hydroinform Prague and the state enterprise Povodí Labe. A number of parameters are measured on the verticals. However, for some of them, the results are not readily available, as they are measured on collected water samples after transport to the Elbe River Basin laboratories. For current presentation on the Internet, the digitized results of parameters determined directly in the field (In-situ) with a multiparameter analyzer YSI 6600 (see image top left) are most suitable. To form a basic idea of the current development of water quality in the reservoir, the following six parameters are published via the Internet: |
| WATER TEMPERATURE |
| By displaying the distribution of temperature conditions in the entire accumulation, it is possible to observe the formation of basic volume structures in the reservoir, the emergence of which predetermines the processes that subsequently participate in the development of water quality. With the onset of summer conditions, so-called summer thermal stratification forms in deeper reservoirs. This phenomenon is related to the uneven heating of water at different depths and the decrease in its density with increasing temperature. The result is the creation of two separate water bodies – the epilimnion (at the surface) and the hypolimnion (above the bottom). Both formations are separated by a so-called thermocline layer (see figure bottom right). In each of these defined spaces, different processes take place, which induce different conditions in both bodies. The distribution of other substances - oxygen, manganese, nitrites, phosphorus, etc. - is also related to the formation of thermal stratification (thermal zonation). At sustained high air temperatures and a low exchange coefficient, this differentiation is very stable and can be recorded in the reservoir for up to several months. |
 |
| In the winter period, winter thermal stratification is formed, which is not as pronounced. Because water has its highest density at approximately 4oC - the thermal anomaly of water - the warmest water remains at the bottom and the coldest is at the surface. This phenomenon prevents the reservoirs from freezing completely to the bottom during the winter period. |
| OXYGEN CONTENT |
|
The life of most aquatic organisms is completely unthinkable without the presence of oxygen. The source of oxygen in waters is primarily diffusion (transfer) from the atmosphere and the photosynthesis of green plants. Oxygen, on the other hand, is consumed by the respiration of aquatic animals and during the decomposition of organic matter. As a result of thermal stratification, in deeper eutrophic reservoirs, oxygen is often completely depleted in the lower layers (hypolimnion) (so-called anoxia). Such a situation reduces the suitable space for the fish stock and worsens conditions for sport fishing. At the same time, processes are created that adversely affect water quality because substances such as hydrogen sulfide, methane, sulfur compounds, and carbon dioxide are formed. There is also a transition of some undesirable substances bound in the sediment into a form dissolved in water (manganese, iron, phosphorus). Because the solubility of oxygen in water decreases with increasing temperature, oxygen deficits are primarily associated with high summer temperatures. |
| OXYGEN SATURATION PERCENTAGE | ||||||||||
|
A much more understandable tool for presenting oxygen conditions is often the
so-called oxygen saturation percentage. This parameter also includes the dependence of oxygen content in water on temperature conditions and also reacts to changes in air pressure. Due to intensive photosynthesis, strong oxygen supersaturation sometimes occurs in heavily eutrophic reservoirs with a large amount of algae and cyanobacteria at a depth of 2 - 3 m below the surface. Values exceeding 160% saturation are often found. Also in winter (even under thick ice with a snow cover), intensive oxygen development can occur at the surface as a result of the assimilation of green plants, and the values of this parameter far exceed one hundred percent saturation. Below are the values that represent the critical limit for some fish species at a temperature of 20oC:
|
| pH VALUE |
|
expresses either the acidic or alkaline reaction of water. Acidity is caused by an excess of hydrogen ions H+ and alkalinity (basicity) by an excess of hydroxyl ions OH-. An equilibrium state in surface waters is characterized by a pH value of 7. Lower values indicate an acidic range, and conversely, values higher than 7 indicate an alkaline range. The pH values in natural surface waters range from 3.5 to 11. Changes in pH value are determined both by the water's chemistry, which reflects the prevailing character of the catchment area, and by processes taking place directly in the reservoir. In general, reservoirs at higher altitudes that are not burdened by wastewater have lower pH values. The acidity of these waters is caused by humic acids from peat bogs. Water from areas with predominantly limestone structures, on the other hand, has higher pH values. In reservoirs, the development of pH values is often regulated by the content of carbon dioxide. High consumption of carbon dioxide by green algae during photosynthesis causes an increase in pH values to over 10 in the epilimnion. In these extreme conditions, fish metabolism is already disturbed. Conversely, at the bottom, due to anaerobic decomposition and significant carbon dioxide development, the pH value can drop below 6. The death of salmonid fish occurs with a prolonged decrease in pH below 4.5 and an increase above 9.2. The death of cyprinid fish occurs with a prolonged decrease in pH below 5.0 and an increase above 10.8. |
| TURBIDITY | |||||||||||||||
|
is one of the parameters documenting the optical properties of water. Its values at the surface allow for assessing the intensity of sunlight penetration into the water body. Turbidity is also a measure of the availability of light energy for green plants (algae). Light is a necessary condition for their growth and reproduction. Changes in turbidity in the water column, however, also depict the course of transport processes in the reservoir, both horizontal (material carried by tributaries) and vertical (development of microbial communities at the bottom). The turbidity value is determined according to the amount of light that is reflected from undissolved substances in the surrounding solution. The light source and a highly sensitive light detector (photodiode) are part of the measuring device. Turbidity values are expressed in NTU units (determined by the manufacturer of the sensor used). Calibration to values of 0 and 100 is performed using a standard formazin solution. Although precise measurement of turbidity in a natural environment is subject to a number of objective errors (particle clumps, escaping gas bubbles, etc.), the following approximate classification can be established:
|
| CHLOROPHYLL-A |
|
A brief characterization of the parameter is given in the chapter "Chlorophyll-a at the dam" . However, displaying the distribution of chlorophyll-a in the reservoir space much better reflects the actual situation
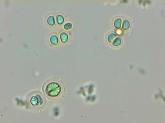
in the reservoir than a mere surface sample. A parameter presented in this way is not as affected by random phenomena such as wind direction and strength or the intensity of sunlight. The distribution of chlorophyll (and thus green algae and cyanobacteria) mapped in this way also has longer-term validity. From experience, it can be stated that unless extraordinary circumstances occur (increased inflow, a significant change in temperature or sunlight), the distribution of chlorophyll does not change for 15 to 20 days. For the determination of chlorophyll-a, fluorometric determination in the field is used according to the procedure specified by the manufacturer of the multiparameter analyzer (YSI company). For the correct interpretation of the measured values, a conversion is used that is calibrated by the results of analyses using the standardized US EPA method No. 445.0. From the visualization obtained by this method, it is often clear that photosynthesizing organisms are present in high concentrations at the surface. While this makes recreation unpleasant or impossible, the water intake located at a suitable depth may be unaffected. The development of chlorophyll concentration in the longitudinal profile also shows the uneven distribution of algae and cyanobacteria in the reservoir. When interpreting the obtained visualizations, however, it is always necessary to bear in mind that living organisms are detected in this way, which are capable of very rapid reactions to changing living conditions. The short-term disappearance of some species from parts of the water column with changing atmospheric pressure or during the alternation of day and night are only a confirmation of this fact. The attached photographs show four species of cyanobacteria that often cause so-called "reservoir blooms". In the case of the occurrence of these species of autotrophic organisms in reservoirs with "bathing places," swimming is prohibited according to Decree No. 464/2000 Coll. |
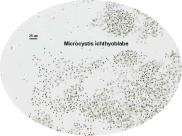 |
Microcystis ichtyoblabe (scale 25 µm) | 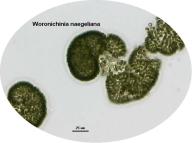 |
| Woronichinia naegeliana (scale 25 µm) | ||
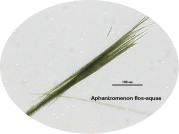 |
Aphanizomenon flos-aquae (scale 100 µm) | 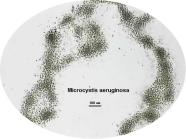 |
| Microcystis aeruginosa (scale 100 µm) | ||
| 5. CONTACT |
| koza@pla.cz | |
| rederer@pla.cz |